-
Kafka Monitoring 환경 구축Kafka 2024. 8. 30. 19:52
오늘은 카프카 Lag을 모니터링 하기 위한 Grafana 모니터링 환경을 구축하려고 합니다.
어떤 것들을 설치했고, 어떻게 구성했는지 기록하며 복기해보도록 하겠습니다..!
설치 목록
- kafka-exporter
- prometheus
- grafana
설치 환경 - 리눅스
- localhost
- kafka-exporter (docker)
- prometheus (bin)
- grafana (bin)
- Test-Server
- Kafka
1. kafka-exporter 설치
설치 : https://hub.docker.com/r/danielqsj/kafka-exporter
https://hub.docker.com/r/danielqsj/kafka-exporter
hub.docker.com
- docker run -ti --rm -p 9308:9308 danielqsj/kafka-exporter --kafka.server=<kafka>:9092
🤬 설치 할 시 kafka.server가 잡히지 않는다면 체크해봐야할 사항
- kafka 실행중인지 확인
- kafka의 config (config/kraft/) 폴더 내 server.properties 파일 확인
- advertised.listeners 설정에 PLAINTEXT://<host ip>:9092 설정 확인
- 방화벽 확인 : 해당 포트 열려있는지 확인
- sudo firewall-cmd --permanent --add-port=9092/tcp
- sudo firewall-cmd --reload
2. prometheus 설치 및 설정
# my global config
global:
 scrape_interval: 1s # Set the scrape interval to every 15 seconds. Default is every 1 minute.
 evaluation_interval: 1s # Evaluate rules every 15 seconds. The default is every 1 minute.
 # scrape_timeout is set to the global default (10s).
# Alertmanager configuration
alerting:
 alertmanagers:
 - static_configs:
 - targets:
 # - alertmanager:9093
# Load rules once and periodically evaluate them according to the global 'evaluation_interval'.
rule_files:
 # - "first_rules.yml"
 # - "second_rules.yml"
# A scrape configuration containing exactly one endpoint to scrape:
# Here it's Prometheus itself.
scrape_configs:
 # The job name is added as a label `job=<job_name>` to any timeseries scraped from this config
 - job_name: "<이름 설정>"
	 # metrics_path defaults to '/metrics'
	 # scheme defaults to 'http'.
 static_configs:
 - targets: ["<localhost>:9308"]
3. Grafana
설치 : https://grafana.com/grafana/download?pg=get&plcmt=selfmanaged-box1-cta1&platform=linux
Download Grafana | Grafana Labs
Overview of how to download and install different versions of Grafana on different operating systems.
grafana.com
dashboard -> kafka에 맞는 화면을 구성해줍니다!
설치 : https://grafana.com/grafana/dashboards/7589-kafka-exporter-overview/
Kafka Exporter Overview | Grafana Labs
Thank you! Your message has been received!
grafana.com
실행화면
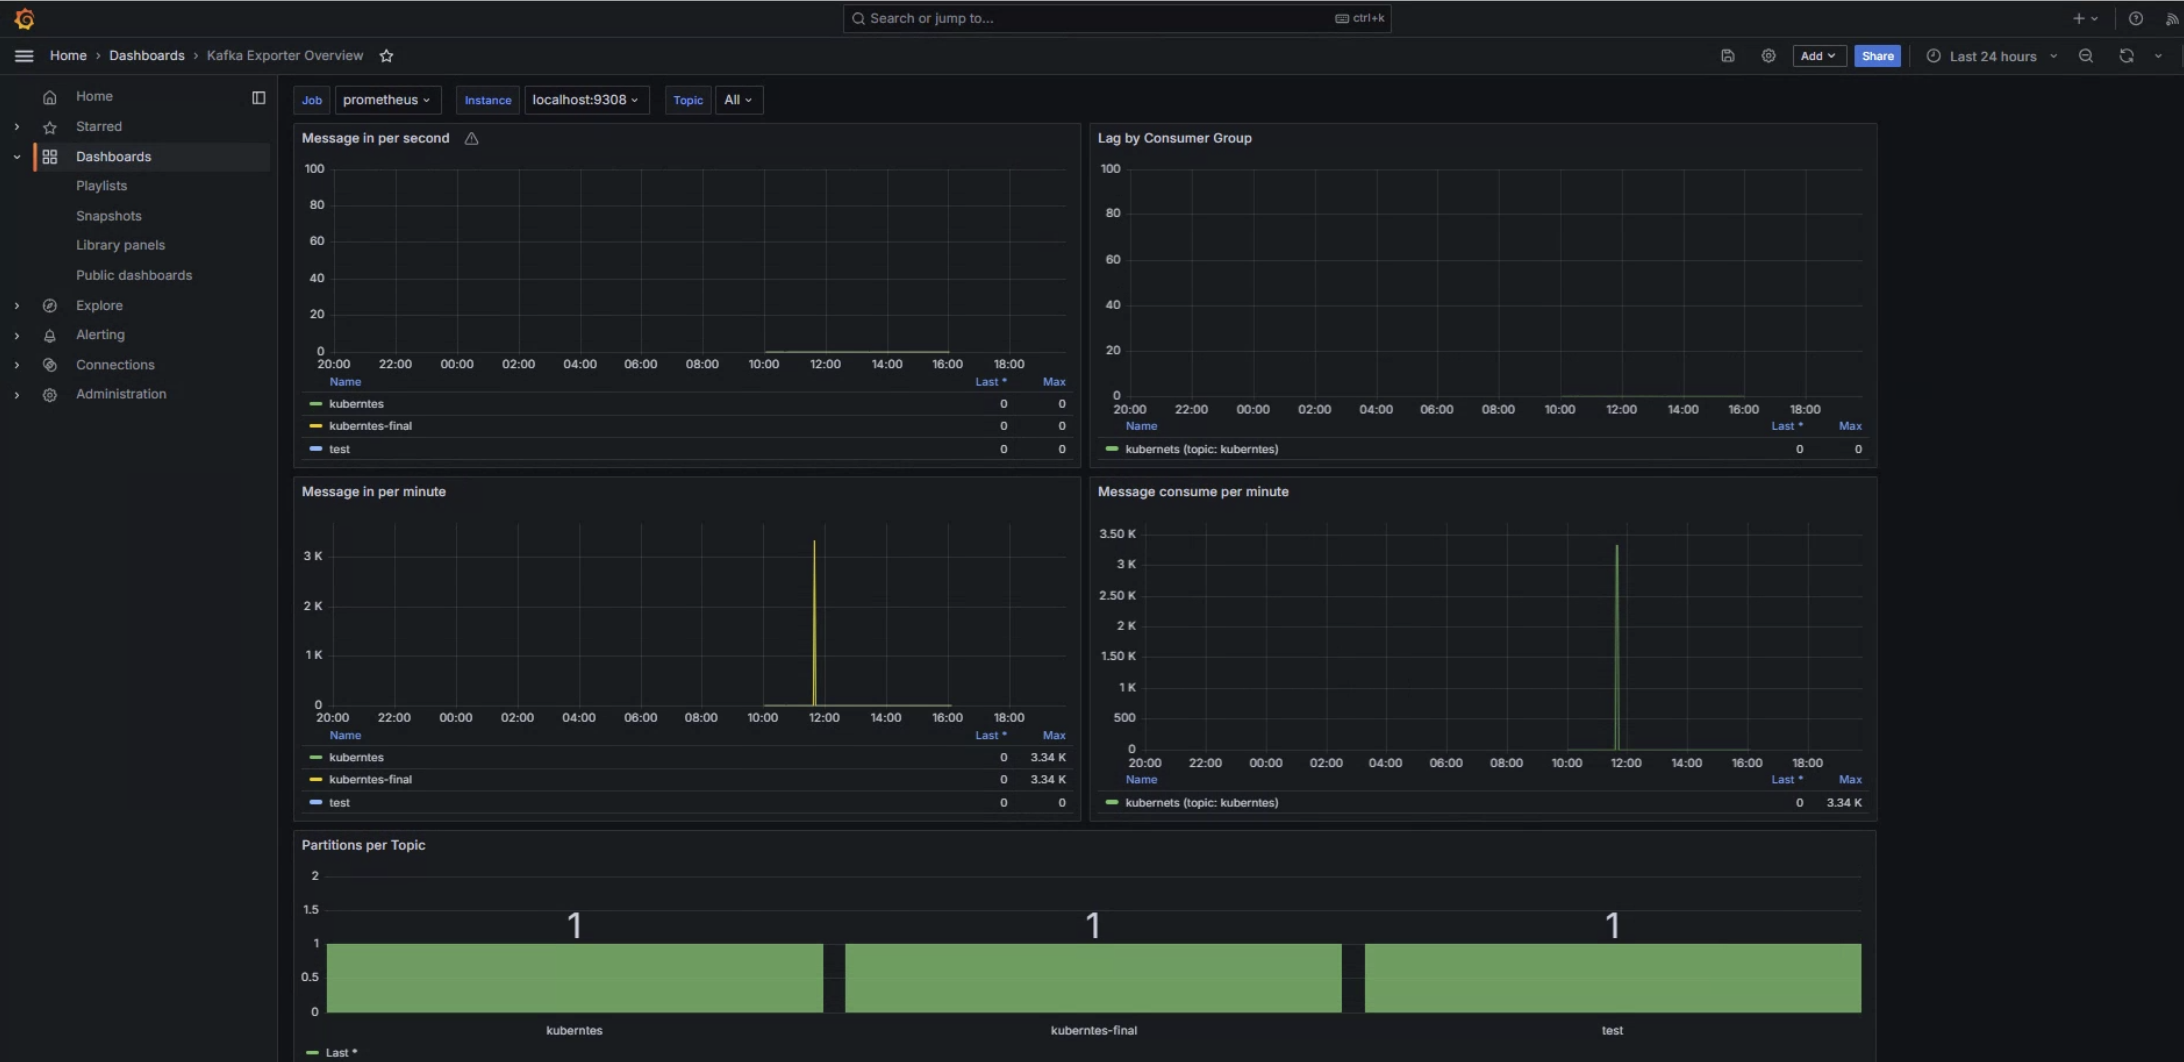
이렇게 해서 모니터링 화면을 구성해보았습니다..!